ANZ Group - Value Chain Analysis (1H26)
Beneath the value map is our value chain. A value chain represents a set of activities organisations engage in to serve their customers. In the context of ANZ, we’re already aware of the customer shift towards digital banking and self service which is causing banks to rethink their value proposition.
As the value chain creates and captures value end-to-end - it gives us guidelines to understand where margin is gained and where it leaks. As I work in tech sales, I run it tech-delivery-first and then cascade upward: from the engineering stack that ships change, through the activities that serve customers, into the strategy pillars and the board-level numbers the C-suite is judged on. We work bottom-up because the opportunities usually live lower in the chain. This is where I can work to earn my conversations into the executive layer.
1. The two lenses, and which way they run
How the analysis is constructed, and the direction of causality.
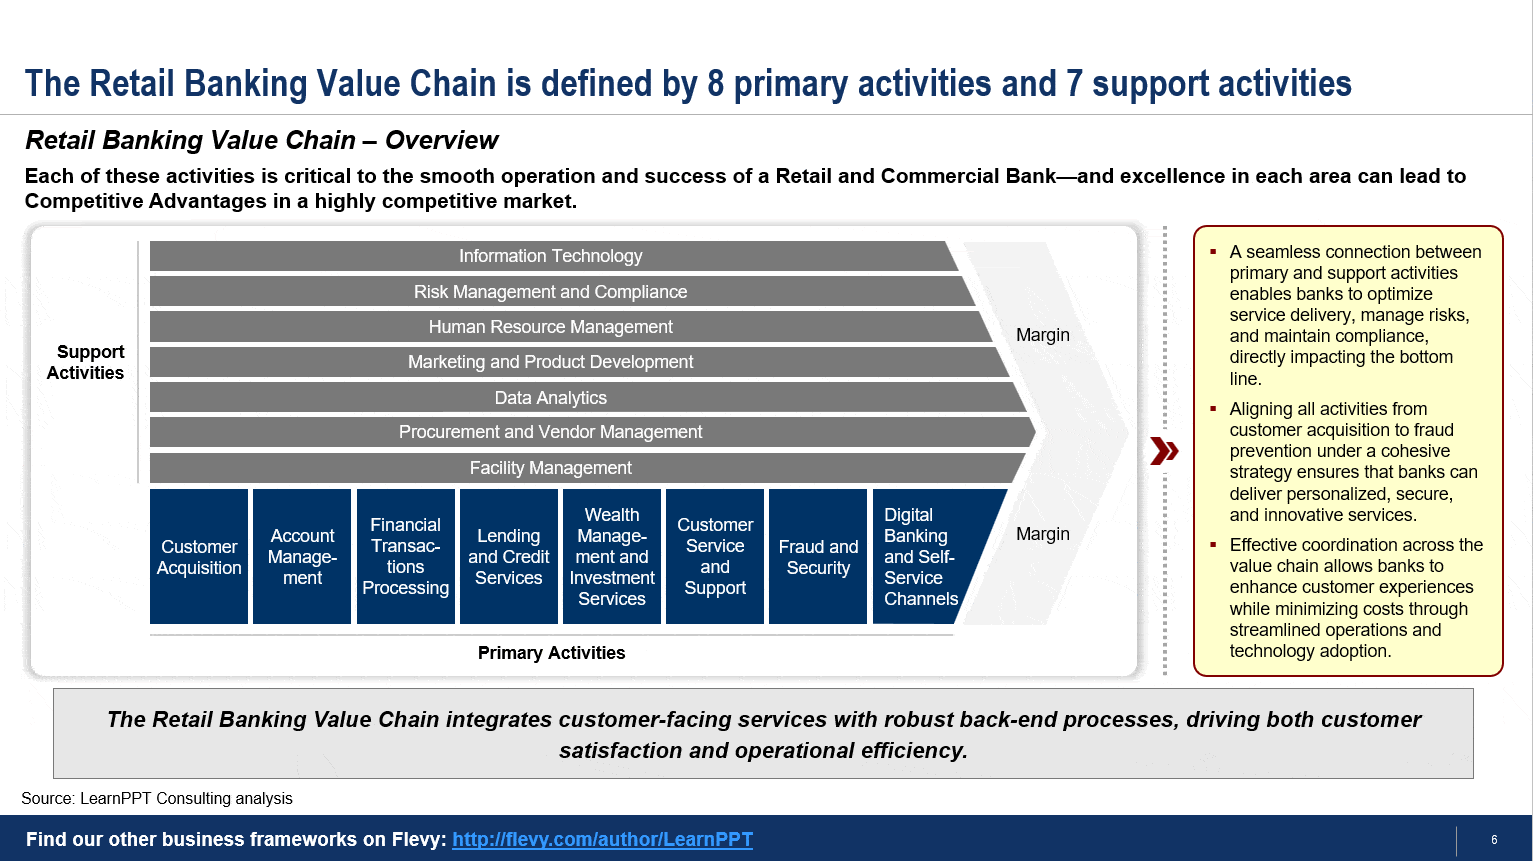
We use two views. First, the industry lens (the retail-banking value chain: primary + support activities) shows where the bank creates value for customers. The delivery lens (ANZ’s technology stack, L1–L9) shows where its ability to change those activities actually lives. I lead with the delivery lens because ANZ’s entire 2030 strategy is a technology-and-operating-model transformation in disguise — the funded initiatives, the burning platforms, and the budget owners all sit in the stack.
1
2
3
4
5
6
7
8
9
10
11
INDUSTRY LENS (what the bank does)          DELIVERY LENS (how change ships)
─────────────────────────────────           ─────────────────────────────────
P1 Customer acquisition                     L1 Channels & front-end
P2 Account management                       L2 Origination & onboarding
P3 Transactions & payments                  L3 Core banking & product engines
P4 Lending & credit                         L4 Payments & transaction banking
P5 Wealth & investment                      L5 Data, analytics & AI
P6 Customer service & support               L6 Integration / API / middleware
P7 Fraud, security & financial crime        L7 Risk & compliance tech
P8 Digital banking & self-service           L8 Cloud & engineering platform
S1–S7 Support activities                    L9 Software delivery & change capability ← meta-layer
2. The cascade - delivery ladders up into the C-suite and Board
The mechanism that makes this a selling tool: trace any delivery layer up to a number that is measured.
Read each row bottom to top - a constraint at the delivery layer flows up an activity, into a strategy pillar, into a corporate objective. If you can move the bottom, you move the top; this creates a compelling reason for executives to meet. Below are a set of theories to test and validate with the customer.
| Delivery layer (the lever) | Activity it gates | Strategy pillar | Corporate objective it moves | The number |
|---|---|---|---|---|
| L9 Delivery & change capacity | All change, everywhere | Simplicity | Cost-to-income mid-40s by FY28 | $875m FY26 productivity; costs down ~5% |
| L1/L6 Front-end & integration | P6 servicing, P8 digital | Customer First | RoTE → 12% by FY28 (growth thesis) | SCFE 13%→45%→100% by Sept 2027 |
| L5 Data & AI | P3, P4, P7 | Resilience + Simplicity | NFR “well-managed”; mid-40s CTI | Suncorp $500m synergies from FY29 |
| L2 Origination | P1 acquisition, P4 lending | Customer First | Revenue growth (Phase 2) | Home lending 0.36×→0.85× system |
| L4 Payments platforms | P3 transactions | Customer First / Delivering Value | Capital-light revenue, RoE | Operational deposits +28% over 2 yrs |
| L7 Risk & compliance tech | P7 fraud/NFR | Resilience | Mitigate non-financial risk | RCRP / PACT, Promontory-assured |
The one-line read: the bottom row - L9 delivery capacity is the lever under every objective, and it’s the one ANZ deliberately weakened this year (−3,500 FTE, −1,000 consultants, −8% vendors). Everything above it is a promise that depends on it.
3. Primary activities
The customer-facing chain, graded, with the tech layer and funded initiative behind each link. I’ve used the FY26H1 details to get insights and build a working hypothesis.
| # | Activity | 1H26 evidence | Read | Layers | Initiative |
|---|---|---|---|---|---|
| P1 | Customer acquisition | Aus Retail MFI 11.6% (−0.1); home lending 0.36×→0.85× system through the half; migrant & mass-affluent propositions in build; ~¼ of Institutional deposit growth from new clients | 🟡 leaking but turning | L1, L2 | Differentiated propositions; proprietary origination |
| P2 | Account management | Save & transact deposits +$16bn (cc) — deliberate low-cost-funding mix-shift; three online-saver products on three platforms → one suite post-SCFE | 🟢 quiet strength | L1, L3 | SCFE product harmonisation |
| P3 | Transactions & payments | Operational deposits +8% HoH, +28% over 2 yrs; Transactive Global release in 2H26; Worldline JV → full ownership | 🟢 the value engine | L4, L6 | Transactive Global; merchant acquiring |
| P4 | Lending & credit | Home loans +$5bn (below system); business lending lags; NZ business/agri 1.1× system; IP loss rate 4bps (long-run 11); CP balance $4.45bn | 🟢 risk / 🟡 growth | L2, L3, L5 | Banker force +~50% by 2030 |
| P5 | Wealth & investment | Private Bank deposits +6%, FUM +8%, lending +17%; Australia’s Best Private Bank (Euromoney) | 🟢 outperformer | L1, L5 | Private Bank acceleration |
| P6 | Customer service & support | Aus Retail NPS +2.9 (#4); B&PB NPS −4.2, down 2.4pts (#4); NZ business NPS −3.5; contact-centre re-platform, ATM, branch refresh in flight | 🔴 the leak | L1, L6 | Channel modernisation |
| P7 | Fraud, security & NFR | RCRP APRA-approved; PACT through set-up; 2nd Promontory report published; ASIC matters program | 🟡 remediation, well-governed | L7, L5 | PACT / RCRP |
| P8 | Digital & self-service | ANZ Plus cloud-native but alongside legacy; SCFE 13%→45%→Sept 2027; agentic AI live in B&PB CRM; NZ data records migrated | 🟡→🟢 the big bet | L1, L3, L6, L8 | SCFE; NZ re-platform; agentic AI |
Support activities (IT, risk, HR, marketing, data, procurement, facilities) are all mid-reset - investment consolidating onto strategy (~$1.5bn envelope, “Digital Front End” line), the centre shrinking while the front line grows, and vendors being rationalised 8% (so any new vendor must enter as a capacity multiplier, not a line item).
4. The delivery stack
This layer is where ANZ’s ability to keep its promises actually sits.
| Layer | State (1H26) | The tension |
|---|---|---|
| L1 Channels & front-end | ANZ Plus alongside legacy; SCFE 13% | One brand promised over many backends (→ C1) |
| L3 Core & product engines | ANZx cloud-native core; NZ re-platforming; legacy cores still live | Cores aren’t replaced — convergence happens above them |
| L5 Data & AI | Suncorp core data solution; agentic AI in CRM | Data quality gates the June-2027 migration (→ C3) |
| L6 Integration | Two cores + Suncorp + ANZ Plus | The unglamorous layer where Sept-2027 is won or lost (→ C1) |
| L7 Risk & compliance tech | RCRP/PACT under published assurance | Evidence generation competes with build capacity (→ C4) |
| L9 Delivery & change | −3,500 FTE, −1,000 consultants, −8% vendors in the same year as the hardest programs ever | The binding constraint — $875m productivity must coexist with peak change demand (→ C2) |
5. Where value leaks
Understanding where the chain is losing value today, and why it’s structural.
P6 servicing / customer experience is the open wound. Aus Retail NPS +2.9 and B&PB NPS −4.2, both #4 of the majors, B&PB moving the wrong way, NZ business NPS −3.5. This is the single activity the entire Customer-First pillar exists to fix — and the Phase-2 growth thesis (RoTE → 12–13%) is underwritten by it. It leaks because the front-end that would close it (SCFE, L1/L6) is only 13% built. Ties to value-map C5.
L9 delivery capacity is the leak that hides the others. Every program above is rate-limited by throughput that ANZ deliberately cut this year. The leak isn’t visible as a bad number yet — it shows up as schedule risk on SCFE and Suncorp, and as the gap between “committed by Sept-2027” and “13% done.” Ties to C2.
Cost-to-change in the legacy estate. P2/P4 run on engines that are slow and expensive to change, which is exactly why “mid-40s CTI by FY28” needs re-platforming, not just headcount. The leak is structural: every cycle of change costs more than it should until the engagement layer is modernised. Ties to C6.
Where it does not leak: P3 payments and P5 wealth are compounding strengths — capital-light, sticky, growing. Selling into these is “expand,” not “rescue,” and should be framed accordingly.
6. Where to play
The actionable output: where a seller enters, hottest first, each tied to a value-map row and capability.
- SCFE — front-end over many cores. Biggest gap between promise and current state, hard public Sept-2027 date, CEO-sponsored, quarterly-scoreboarded. Enter at L1/L6. Value-map row 1 · capabilities T1·T2·T3 · buyer: Group Exec Technology + Australia Retail.
- Suncorp data migration + E2E testing. Time-boxed June-2027, regulator- and government-attached, actively in build. Enter at L5. Row 2 · T4·T5 · buyer: integration lead + CDO.
- L9 delivery-capacity multiplier. High, horizontal. Anything framed as “more change per engineer” attaches to the published $875m. Enter at L9. Row 3 · T3·T8 · buyer: CEO/CFO/Tech.
- B&PB / Retail CX uplift. The leak with the clearest economic hook (NPS must move for Phase 2). Enter at L1 + L5. Rows 5–6 · T6·T7 · buyers: B&PB and Australia Retail execs.
- NFR evidence tooling (PACT). Steady, board-level, governance-heavy, longer cycle. Enter at L7. Row 4 · T5 · buyer: CRO.
Where not to play: anything requiring core rip-and-replace (they’ve chosen build/buy/leverage and won’t reopen it); net-new vendor spend pitched as additional during an 8%-vendor-cut; mature Institutional markets platforms.
7. How I use this information
As a working artifact, Section 6 has places to find opportunities and section 2 gives us the language to talk to. The key activity to execute on is taking an executive up the cascade from a problem they own to a number they’re measured on. At its core - this allows us to read the business model which your opportunity fits in.
Sources
- ANZ Group Holdings 1H26 results pack (1 May 2026): Media Release, Results Presentation & Investor Discussion Pack, Results Announcement, earnings-call transcript (Matos/Faruqui + analyst Q&A).
- Industry framework: Retail Banking Industry Value Chain: Deep Dive (Flevy, 2024).
- NPS/MFI: RFI Global, Roy Morgan, Insights HQ/Kantar as cited by ANZ.
- Cross-referenced to ANZ Value Map